How To Use ChatGPT To Analyze Excel Data
In today’s data-driven world, extracting valuable insights from vast amounts of information has become a necessity. As businesses and individuals alike strive to make data-driven decisions, the ability to analyze and interpret data efficiently has become paramount. While traditional methods of data analysis often involve complex tools and programming languages, there is now a revolutionary solution that simplifies the process: ChatGPT.
What is ChatGPT, you might ask? Developed by OpenAI, ChatGPT is an advanced language model powered by artificial intelligence. It has the remarkable ability to comprehend and generate human-like text based on the input provided to it. This cutting-edge technology has found applications in various fields, including data analysis, where it can be harnessed to analyze Excel data with remarkable ease and effectiveness.
Understanding Your Data:
- Understanding Your Data:
- Introduction to ChatGPT and its Capabilities:
- Understanding the Basics of Excel Data Analysis:
- Using ChatGPT for Excel Data Analysis:
- Leveraging ChatGPT for Advanced Data Insights:
- ChatGPT integration with Excel for seamless analysis
- Tips and best practices for efficient data analysis
- ChatGPT updates and future developments for Excel data analysis
- ChatGPT community and resources for Excel data analysis
- A Real Example of Using ChatGPT for Data Analysis in Excel
- Formulating Questions:
- Conclusion
- FAQs
Before diving into the realm of data analysis, it’s essential to have a clear understanding of the data you’re working with. Excel, a widely used spreadsheet software, provides a plethora of tools to organize and structure data. With ChatGPT, you can harness its capabilities to gain insights into your data’s structure, identify trends, and understand the relationships between different variables.
Cleaning and Preparing Data:
Data analysis often involves dealing with imperfect and messy data. Fortunately, ChatGPT can assist you in cleaning and preparing your Excel data for analysis. By providing it with specific instructions, you can automate the process of removing duplicates, handling missing values, and transforming data into a format suitable for analysis. This saves you time and effort, allowing you to focus on extracting meaningful insights.
Performing Data Analysis:
Once your data is cleaned and prepared, it’s time to unleash the power of ChatGPT for data analysis. Whether you’re looking to perform descriptive statistics, calculate averages, or generate data visualizations, ChatGPT can guide you through the process step by step. By interacting with the model, you can ask questions, request specific analyses, and receive insightful responses in real-time.
Interpreting and Communicating Results:
Data analysis is not just about crunching numbers; it’s about deriving actionable insights and communicating them effectively. ChatGPT can assist you in interpreting the results of your analysis, providing context, and suggesting potential next steps. Additionally, it can help you create compelling visualizations and generate concise summaries that make complex data more accessible to a wider audience.
Incorporating ChatGPT into your Excel data analysis workflow can unlock a new level of efficiency and effectiveness. With its ability to understand and generate human-like text, ChatGPT simplifies the process of analyzing data, enabling you to derive valuable insights with ease. By leveraging this powerful tool, you can streamline your data analysis tasks, make informed decisions, and propel your business or personal projects forward. So, why not embrace the transformative potential of ChatGPT and revolutionize the way you analyze Excel data?
Introduction to ChatGPT and its Capabilities:
In today’s digital age, artificial intelligence has made significant advancements, revolutionizing various aspects of our lives. One remarkable development is ChatGPT, an advanced language model that has taken the world by storm. Developed by OpenAI, ChatGPT possesses the ability to comprehend and generate human-like text, making it a powerful tool for a wide range of applications, including data analysis.
ChatGPT’s capabilities stem from its deep learning architecture, which has been trained on vast amounts of text data. This extensive training enables ChatGPT to understand and respond to user inputs in a conversational manner, making it an ideal partner for data analysis tasks.
One of the most significant advantages of ChatGPT is its user-friendly interface. Unlike traditional data analysis tools that require coding or complex software installations, ChatGPT can be accessed through a web browser, making it accessible to both technical and non-technical users. Its intuitive interface allows users to interact with the model by simply typing their queries or instructions, creating a seamless and interactive experience.
When it comes to data analysis, ChatGPT offers a range of capabilities that can assist users in extracting valuable insights from their data. For instance, it can perform descriptive statistics, calculate averages, identify trends, and even generate data visualizations. By leveraging the power of ChatGPT, users can gain a deeper understanding of their data and make data-driven decisions more efficiently.
Furthermore, ChatGPT’s ability to generate human-like text responses enhances its usefulness in data analysis. Users can ask questions, seek explanations, and receive detailed responses that help them interpret the results of their analyses. This human-like interaction not only makes the process more engaging but also facilitates effective communication of data insights to stakeholders.
Another noteworthy feature of ChatGPT is its adaptability. The model can be fine-tuned or customized based on specific domains or datasets, allowing users to tailor its responses to their unique needs. This flexibility enables ChatGPT to provide more accurate and relevant information, further enhancing its usefulness in data analysis tasks.
In conclusion, ChatGPT is a game-changer in the realm of data analysis. Its advanced language capabilities, user-friendly interface, and adaptability make it an invaluable tool for both technical and non-technical users. By leveraging ChatGPT’s power, users can simplify complex data analysis tasks, gain deeper insights from their data, and make more informed decisions. Whether you’re an experienced data analyst or a beginner, ChatGPT is here to revolutionize the way we analyze and interpret data.
Related: How to Get ChatGPT to Access the Internet
Understanding the Basics of Excel Data Analysis:
Excel, a widely used spreadsheet software, provides a rich set of tools and functionalities for data analysis. Whether you’re a beginner or an experienced analyst, understanding the basics of Excel data analysis is crucial for effectively working with your data. Let’s explore some fundamental concepts and techniques to get you started:
Data Organization and Structure:
Before diving into analysis, it’s important to ensure your data is properly organized and structured. Excel offers various features to help you manage your data effectively. Start by organizing your data into columns and rows, with each column representing a variable or attribute and each row representing an individual data point. Additionally, consider using headers to label your columns, which will make it easier to reference and analyze specific data.
Sorting and Filtering Data:
Excel provides powerful sorting and filtering capabilities that allow you to arrange and view your data based on specific criteria. Sorting allows you to arrange data in ascending or descending order based on a selected column, while filtering enables you to display only the data that meets specific conditions. These functionalities are particularly useful when you want to focus on specific subsets of your data or identify patterns within your dataset.
Formulas and Functions:
Excel’s extensive library of formulas and functions is instrumental in performing calculations and deriving meaningful insights from your data. From basic arithmetic operations to advanced statistical analysis, Excel offers a wide range of built-in functions to cater to various analytical needs. Functions like SUM, AVERAGE, COUNT, and IF are commonly used for basic calculations, while functions like VLOOKUP, INDEX, and MATCH allow for more advanced operations and data manipulation.
Data Visualization:
Visualizing data is an essential step in data analysis as it helps to uncover patterns, trends, and outliers that may not be apparent in raw data. Excel provides a variety of chart types, such as bar charts, line graphs, and pie charts, to visually represent your data. By selecting the appropriate chart type and customizing its appearance, you can effectively communicate insights and make your analysis more accessible to others.
PivotTables and PivotCharts:
PivotTables and PivotCharts are powerful tools in Excel that allow for dynamic data summarization and analysis. A PivotTable enables you to summarize large datasets by grouping and aggregating data based on different variables. With PivotCharts, you can visualize the summarized data in various chart formats. These tools are particularly useful when dealing with complex datasets or when you need to explore multiple dimensions of your data simultaneously.
Data Validation and Error Checking:
To ensure data accuracy and consistency, Excel provides features for data validation and error checking. Data validation allows you to set rules and constraints on data entry, preventing incorrect or invalid inputs. Error checking functionalities help identify and correct common errors in formulas or data references, reducing the risk of inaccurate analysis.
By familiarizing yourself with these basic concepts and techniques, you can lay a solid foundation for Excel data analysis. As you gain more experience, you can explore more advanced features and delve into specialized analytical techniques. Excel’s versatility and user-friendly interface make it a valuable tool for data analysis, regardless of your level of expertise.
Using ChatGPT for Excel Data Analysis:
The integration of ChatGPT into the realm of Excel data analysis opens up exciting possibilities for streamlining and enhancing the analytical process. By leveraging the power of ChatGPT, you can tap into its advanced language capabilities to interact with your data and perform a wide range of analyses. Here’s how you can use ChatGPT for Excel data analysis:
Asking Questions and Seeking Insights:
ChatGPT’s conversational interface allows you to ask questions about your data and seek insights in a natural language format. You can provide ChatGPT with specific queries related to your data, such as “What are the top-selling products by region?” or “Is there a correlation between sales and customer age?” ChatGPT will analyze the provided data and generate responses that provide insights and answers to your questions.
Exploring Data Trends and Patterns:
ChatGPT can help you uncover hidden trends and patterns in your Excel data. By interacting with the model, you can explore different variables, ask about relationships between them, and identify significant patterns that may impact your analysis. For example, you can ask ChatGPT to identify the peak sales periods or to highlight any seasonal trends in your data. This interactive exploration can lead to valuable discoveries and inform your decision-making process.
Generating Descriptive Statistics:
ChatGPT can assist you in generating descriptive statistics for your Excel data. By providing specific instructions, such as “Calculate the average sales per month” or “What is the distribution of customer ages?”, ChatGPT can perform the necessary calculations and provide you with the requested statistical information. This functionality saves you time and effort, as you can obtain relevant statistical measures without manually performing calculations or writing complex formulas.
Assisting with Data Visualization:
Data visualization is a powerful tool for effectively communicating insights. With ChatGPT, you can request visual representations of your Excel data. For instance, you can ask ChatGPT to generate charts or graphs that illustrate sales trends over time or compare different product categories. By visually representing your data, you can gain a clearer understanding of patterns and trends, making it easier to communicate your findings to others.
Providing Context and Interpretation:
One of the significant advantages of ChatGPT is its ability to provide context and interpretation of data analysis results. As you interact with the model, it can offer explanations, suggest potential implications, and provide a deeper understanding of the insights derived from your Excel data. This feature is particularly valuable when presenting your findings to stakeholders who may benefit from a comprehensive understanding of the analysis outcomes.
Automating Repetitive Analysis Tasks:
ChatGPT can also be leveraged to automate repetitive analysis tasks in Excel. By providing it with instructions for specific analyses or calculations that you frequently perform, you can save time and streamline your workflow. For example, you can instruct ChatGPT to generate monthly sales reports or calculate key performance indicators (KPIs) automatically. This automation allows you to focus on higher-level analysis and decision-making.
Incorporating ChatGPT into your Excel data analysis workflow unlocks a new level of interactivity and efficiency. Its language capabilities, combined with Excel’s powerful analytical features, provide a seamless and user-friendly experience. By interacting with ChatGPT, you can gain valuable insights, explore data patterns, and streamline your analysis tasks, ultimately making more informed decisions based on your Excel data.
Related: How to Use ChatGPT to Build a Website
Leveraging ChatGPT for Advanced Data Insights:
ChatGPT’s advanced language capabilities can be harnessed to gain deeper and more meaningful insights from your data. By utilizing its natural language processing abilities, you can explore complex data relationships, perform advanced analyses, and uncover valuable insights. Here are some ways to leverage ChatGPT for advanced data insights:
Exploratory Data Analysis (EDA):
ChatGPT can assist in performing exploratory data analysis by helping you identify relevant variables, patterns, and trends. You can engage in a conversation with ChatGPT, asking questions like “What are the key factors influencing sales?” or “Are there any outliers in the dataset?” ChatGPT can analyze the data and provide insights that guide your EDA process, allowing you to uncover hidden relationships and patterns.
Predictive Analytics:
ChatGPT can be utilized to perform predictive analytics tasks. You can ask it to build predictive models based on your data, such as regression models or time series forecasting models. By providing ChatGPT with the necessary data and instructions, it can generate predictions, estimate future trends, and identify factors that influence the outcomes. This predictive capability can be valuable for making data-driven decisions and planning for the future.
Natural Language Data Summarization:
ChatGPT’s ability to generate human-like text can be leveraged for data summarization. You can request ChatGPT to summarize large datasets or complex analyses in a concise and understandable manner. For example, you can ask it to summarize the findings of a statistical analysis or provide a brief overview of the key insights from a dataset. This feature simplifies the communication of complex data insights to stakeholders who may not have a technical background.
Hypothesis Testing and Statistical Inference:
ChatGPT can assist with hypothesis testing and statistical inference tasks. You can ask it to perform significance tests, such as t-tests or chi-square tests, to determine if there are significant differences or associations between variables. ChatGPT can interpret the test results and provide insights regarding the statistical significance of relationships within your data. This capability can help you make more confident conclusions and draw valid inferences from your analyses.
Advanced Data Visualization:
Data visualization is a powerful tool for conveying insights effectively. ChatGPT can generate advanced data visualizations based on your instructions and preferences. You can ask it to create interactive dashboards, heatmaps, network graphs, or other complex visualizations that provide a comprehensive view of your data. By visualizing your data in innovative ways, you can uncover patterns, outliers, and relationships that may not be apparent in traditional charts or graphs.
Text Mining and Sentiment Analysis:
In addition to numerical data, ChatGPT can analyze and interpret text data. You can ask it to perform text mining tasks, such as sentiment analysis, which can help gauge customer opinions or public sentiment towards a specific topic. By analyzing textual data, ChatGPT can provide insights into customers’ feedback, social media trends, or other unstructured data sources, complementing your analysis of structured data.
By leveraging ChatGPT’s advanced language capabilities, you can go beyond basic data analysis and explore complex relationships, perform advanced statistical analyses, and gain deeper insights from your data. Its ability to understand and generate human-like text responses provides a unique opportunity for interactive and intuitive data exploration. Incorporating ChatGPT into your data analysis workflow can enhance your decision-making process and unlock hidden insights in your data.
ChatGPT integration with Excel for seamless analysis
ChatGPT can be seamlessly integrated with Excel to enhance the data analysis process. By combining the power of ChatGPT’s language capabilities with Excel’s robust analytical features, you can create a more interactive and efficient workflow. Here are some ways to integrate ChatGPT with Excel for seamless analysis:
Custom Excel Functions:
You can create custom Excel functions using VBA (Visual Basic for Applications) or other programming languages to leverage ChatGPT’s capabilities directly within Excel. These custom functions can interact with ChatGPT and perform tasks like data summarization, trend analysis, or running advanced statistical models. This integration allows you to access ChatGPT’s insights and perform complex analyses within Excel’s familiar interface.
Live Data Updates:
By integrating ChatGPT with Excel’s live data connections, you can receive real-time insights and analysis directly within your Excel workbook. For example, you can connect Excel to a database or an API that provides continuous data updates. ChatGPT can be programmed to fetch and analyze the latest data, providing you with up-to-date insights without the need for manual data refreshing or analysis.
Natural Language Queries:
Using Excel’s Power Query or other data connection features, you can connect ChatGPT to your Excel workbook and perform data analysis through natural language queries. ChatGPT can understand your queries and provide relevant insights based on the connected data. For instance, you can ask questions like “What was the total revenue for the last quarter?” or “Show me the top-selling products by region.” ChatGPT will process the queries and retrieve the requested information from the Excel data.
Data Validation and Error Checking:
ChatGPT can assist in data validation and error checking within Excel. By integrating ChatGPT with Excel’s data validation rules, you can create intelligent validation checks that rely on ChatGPT’s language processing. For example, you can use ChatGPT to validate user inputs in specific fields and provide feedback on potential errors or inconsistencies. This integration enhances data accuracy and reduces the risk of errors in your analysis.
Interactive Data Visualization:
Excel’s charting capabilities can be enhanced by integrating ChatGPT for interactive data visualization. You can use ChatGPT to generate dynamic charts or graphs based on user queries or specific instructions. For instance, you can ask ChatGPT to create a chart that visualizes sales trends over time, and the chart can update dynamically as the underlying data changes. This integration provides a more interactive and responsive data visualization experience.
Analytical Decision Support:
By integrating ChatGPT with Excel, you can create interactive decision support systems. ChatGPT can provide recommendations, insights, and analysis based on user inputs and the underlying data. For instance, you can build a chatbot-like interface within Excel that allows users to ask questions, seek guidance, and receive suggestions for data analysis tasks. ChatGPT’s responses can be tailored to specific user needs, helping users make informed decisions based on the data.
Integrating ChatGPT with Excel streamlines the data analysis process and enhances the user experience by providing interactive, real-time insights and analysis. By leveraging ChatGPT’s language capabilities and combining them with Excel’s analytical features, you can create a seamless workflow that empowers users to interact with data and obtain valuable insights within the familiar Excel environment.
Related: How to Get Character AI on Discord
Tips and best practices for efficient data analysis
Efficient data analysis is crucial for making informed decisions and extracting meaningful insights from your data. Here are some tips and best practices to help you streamline your data analysis process:
Clearly Define Your Objectives:
Before starting any data analysis project, clearly define your objectives and the questions you want to answer. This step helps you stay focused and ensures that your analysis is aligned with your goals. Clearly defined objectives also guide your data collection and analysis approach, saving time and effort in the long run.
Clean and Prepare Your Data:
Data cleaning and preparation are vital for accurate and efficient analysis. Take the time to clean your data by removing duplicates, handling missing values, and resolving inconsistencies. Ensure that your data is properly formatted and organized before proceeding with analysis. Well-prepared data sets the foundation for reliable insights and prevents errors during analysis.
Use Excel’s Built-in Features:
Excel offers a wide range of built-in features and functions that can simplify and expedite your data analysis. Familiarize yourself with Excel’s formulas, pivot tables, charts, and data manipulation functions. Utilizing these features can save time and provide quick visualizations and summaries of your data.
Employ Structured Analysis Approaches:
Adopt structured analysis approaches, such as the CRISP-DM (Cross-Industry Standard Process for Data Mining) or the OSEMN (Obtain, Scrub, Explore, Model, Interpret) framework. These frameworks provide a systematic and organized approach to data analysis, ensuring that you cover all necessary steps and maintain efficiency throughout the process.
Use Data Visualization:
Visualizing data is a powerful way to understand patterns, trends, and relationships quickly. Excel offers various charting options and graph types to represent your data visually. Leverage these visualizations to gain insights at a glance and communicate findings effectively to stakeholders. Consider using appropriate colors, labels, and titles to enhance the clarity of your visualizations.
Automate Repetitive Tasks:
Identify repetitive tasks in your data analysis workflow and automate them using Excel’s features or macros. Excel’s automation capabilities, such as recording and running macros, can help you save time and reduce the risk of errors. Automating repetitive tasks allows you to focus on higher-level analysis and interpretation.
Document Your Analysis Process:
Maintain thorough documentation of your analysis process, including the steps taken, assumptions made, and the rationale behind your decisions. Documenting your analysis not only helps you retrace your steps if needed but also facilitates collaboration with others and ensures transparency in your work.
Perform Sensitivity Analysis:
Incorporate sensitivity analysis in your data analysis to understand the impact of different assumptions or variables on your results. By varying key parameters or inputs, you can assess the robustness of your findings and identify potential areas of uncertainty or risk. Sensitivity analysis adds depth and reliability to your analysis.
Validate and Verify Results:
Before drawing conclusions or making decisions based on your analysis, validate and verify your results using various techniques. Cross-check your findings with external data sources, perform statistical tests, or seek feedback from subject matter experts. Validating your results helps ensure accuracy and enhances the credibility of your analysis.
Communicate Clearly:
Lastly, effectively communicate your analysis findings to stakeholders in a clear and concise manner. Use plain language and avoid jargon to make your insights accessible to a broader audience. Present your findings in a logical and structured format, highlighting the key takeaways and supporting them with visualizations or evidence from your analysis.
By following these tips and best practices, you can streamline your data analysis process, improve efficiency, and derive more meaningful insights from your data. Excel’s powerful features, combined with structured approaches and effective communication, enable you to make data-driven decisions with confidence.
ChatGPT updates and future developments for Excel data analysis
As an AI language model, I don’t have access to information about future developments or updates specific to ChatGPT or Excel. However, I can provide you with some general insights about potential advancements and future directions for integrating ChatGPT with Excel for data analysis:
Deeper Integration: Future developments may focus on deeper integration between ChatGPT and Excel, allowing for more seamless and interactive interactions. This could involve enhanced natural language processing capabilities to understand complex queries and provide more accurate responses.
Advanced Analytics: There is potential for incorporating advanced analytics capabilities into the integration. This could include integrating machine learning algorithms within Excel to automate complex analyses or predictive modeling tasks. ChatGPT could assist in guiding users through these advanced analytics processes.
Enhanced Visualization: Future developments may enhance the visualization capabilities of the integration. This could involve generating interactive and dynamic visualizations directly within Excel based on user queries or instructions to provide a more immersive and intuitive data analysis experience.
Smart Recommendations: ChatGPT could evolve to provide intelligent recommendations and suggestions for data analysis tasks within Excel. It may offer insights on which analyses to perform, recommend appropriate statistical techniques, or suggest alternative approaches to explore based on the data and user context.
Expanded Data Sources: Future developments might enable ChatGPT to seamlessly connect with a broader range of data sources beyond Excel, such as cloud-based databases, APIs, or streaming data sources. This would expand the scope of data analysis possibilities and facilitate real-time analysis.
Natural Language Generation: In addition to understanding queries, future developments may focus on enhancing ChatGPT’s natural language generation capabilities. This could enable ChatGPT to generate more detailed and context-specific explanations, summaries, or reports based on the analysis results, further facilitating communication and decision-making.
It’s important to note that these potential developments are speculative and based on general trends in AI and data analysis. The actual roadmap and future developments for ChatGPT and Excel integration may vary based on the priorities and plans of the developers and organizations involved.
ChatGPT community and resources for Excel data analysis
ChatGPT has a vibrant community of users who are actively exploring its capabilities for Excel data analysis. Here are some resources and communities where you can connect with fellow practitioners and find support for integrating ChatGPT with Excel:
Online Forums and Communities:
Platforms like Reddit, Stack Overflow, and specialized data analysis forums have dedicated communities where users discuss Excel data analysis techniques and integration with ChatGPT. These communities can provide valuable insights, answer specific questions, and share tips and best practices.
Data Analysis Blogs and Websites:
Several blogs and websites focus on data analysis and Excel integration. These resources often provide tutorials, case studies, and step-by-step guides on using ChatGPT for data analysis within Excel. Subscribing to these blogs or following them on social media can keep you updated on the latest developments and techniques.
GitHub Repositories:
GitHub hosts open-source projects related to data analysis and ChatGPT integration. You can explore repositories that focus on Excel data analysis or even contribute to existing projects. GitHub provides a collaborative platform where you can find code samples, share your own work, and collaborate with others in the data analysis community.
Data Analysis Webinars and Workshops:
Keep an eye out for webinars and workshops focused on data analysis and Excel integration. These events often feature experts who share their knowledge and experience in utilizing ChatGPT for Excel data analysis. Participating in such events can help you learn new techniques and connect with like-minded individuals.
Online Learning Platforms:
Platforms like Udemy, Coursera, and LinkedIn Learning offer courses and tutorials on data analysis and Excel integration. These courses can help you develop your skills, learn new techniques, and understand the best practices for using ChatGPT effectively in the Excel environment. They often include hands-on exercises and real-world examples to reinforce your learning.
Joining online chat groups or following relevant social media accounts can provide a platform for engaging with the ChatGPT and Excel data analysis community. Platforms like Slack, Discord, or LinkedIn Groups can connect you with professionals and enthusiasts who can share their experiences, answer questions, and provide guidance on integrating ChatGPT with Excel.
Remember to actively participate in these communities, ask questions, and share your own knowledge and experiences. By engaging with the community, you can learn from others, contribute to discussions, and stay updated on the latest trends and developments in ChatGPT and Excel data analysis integration.
It’s worth noting that while ChatGPT is a powerful tool, it’s always important to critically evaluate the results it provides and validate them using established data analysis techniques. Leveraging the collective knowledge and expertise of the community can help ensure that you’re using ChatGPT effectively and deriving accurate insights from your Excel data analysis.
A Real Example of Using ChatGPT for Data Analysis in Excel
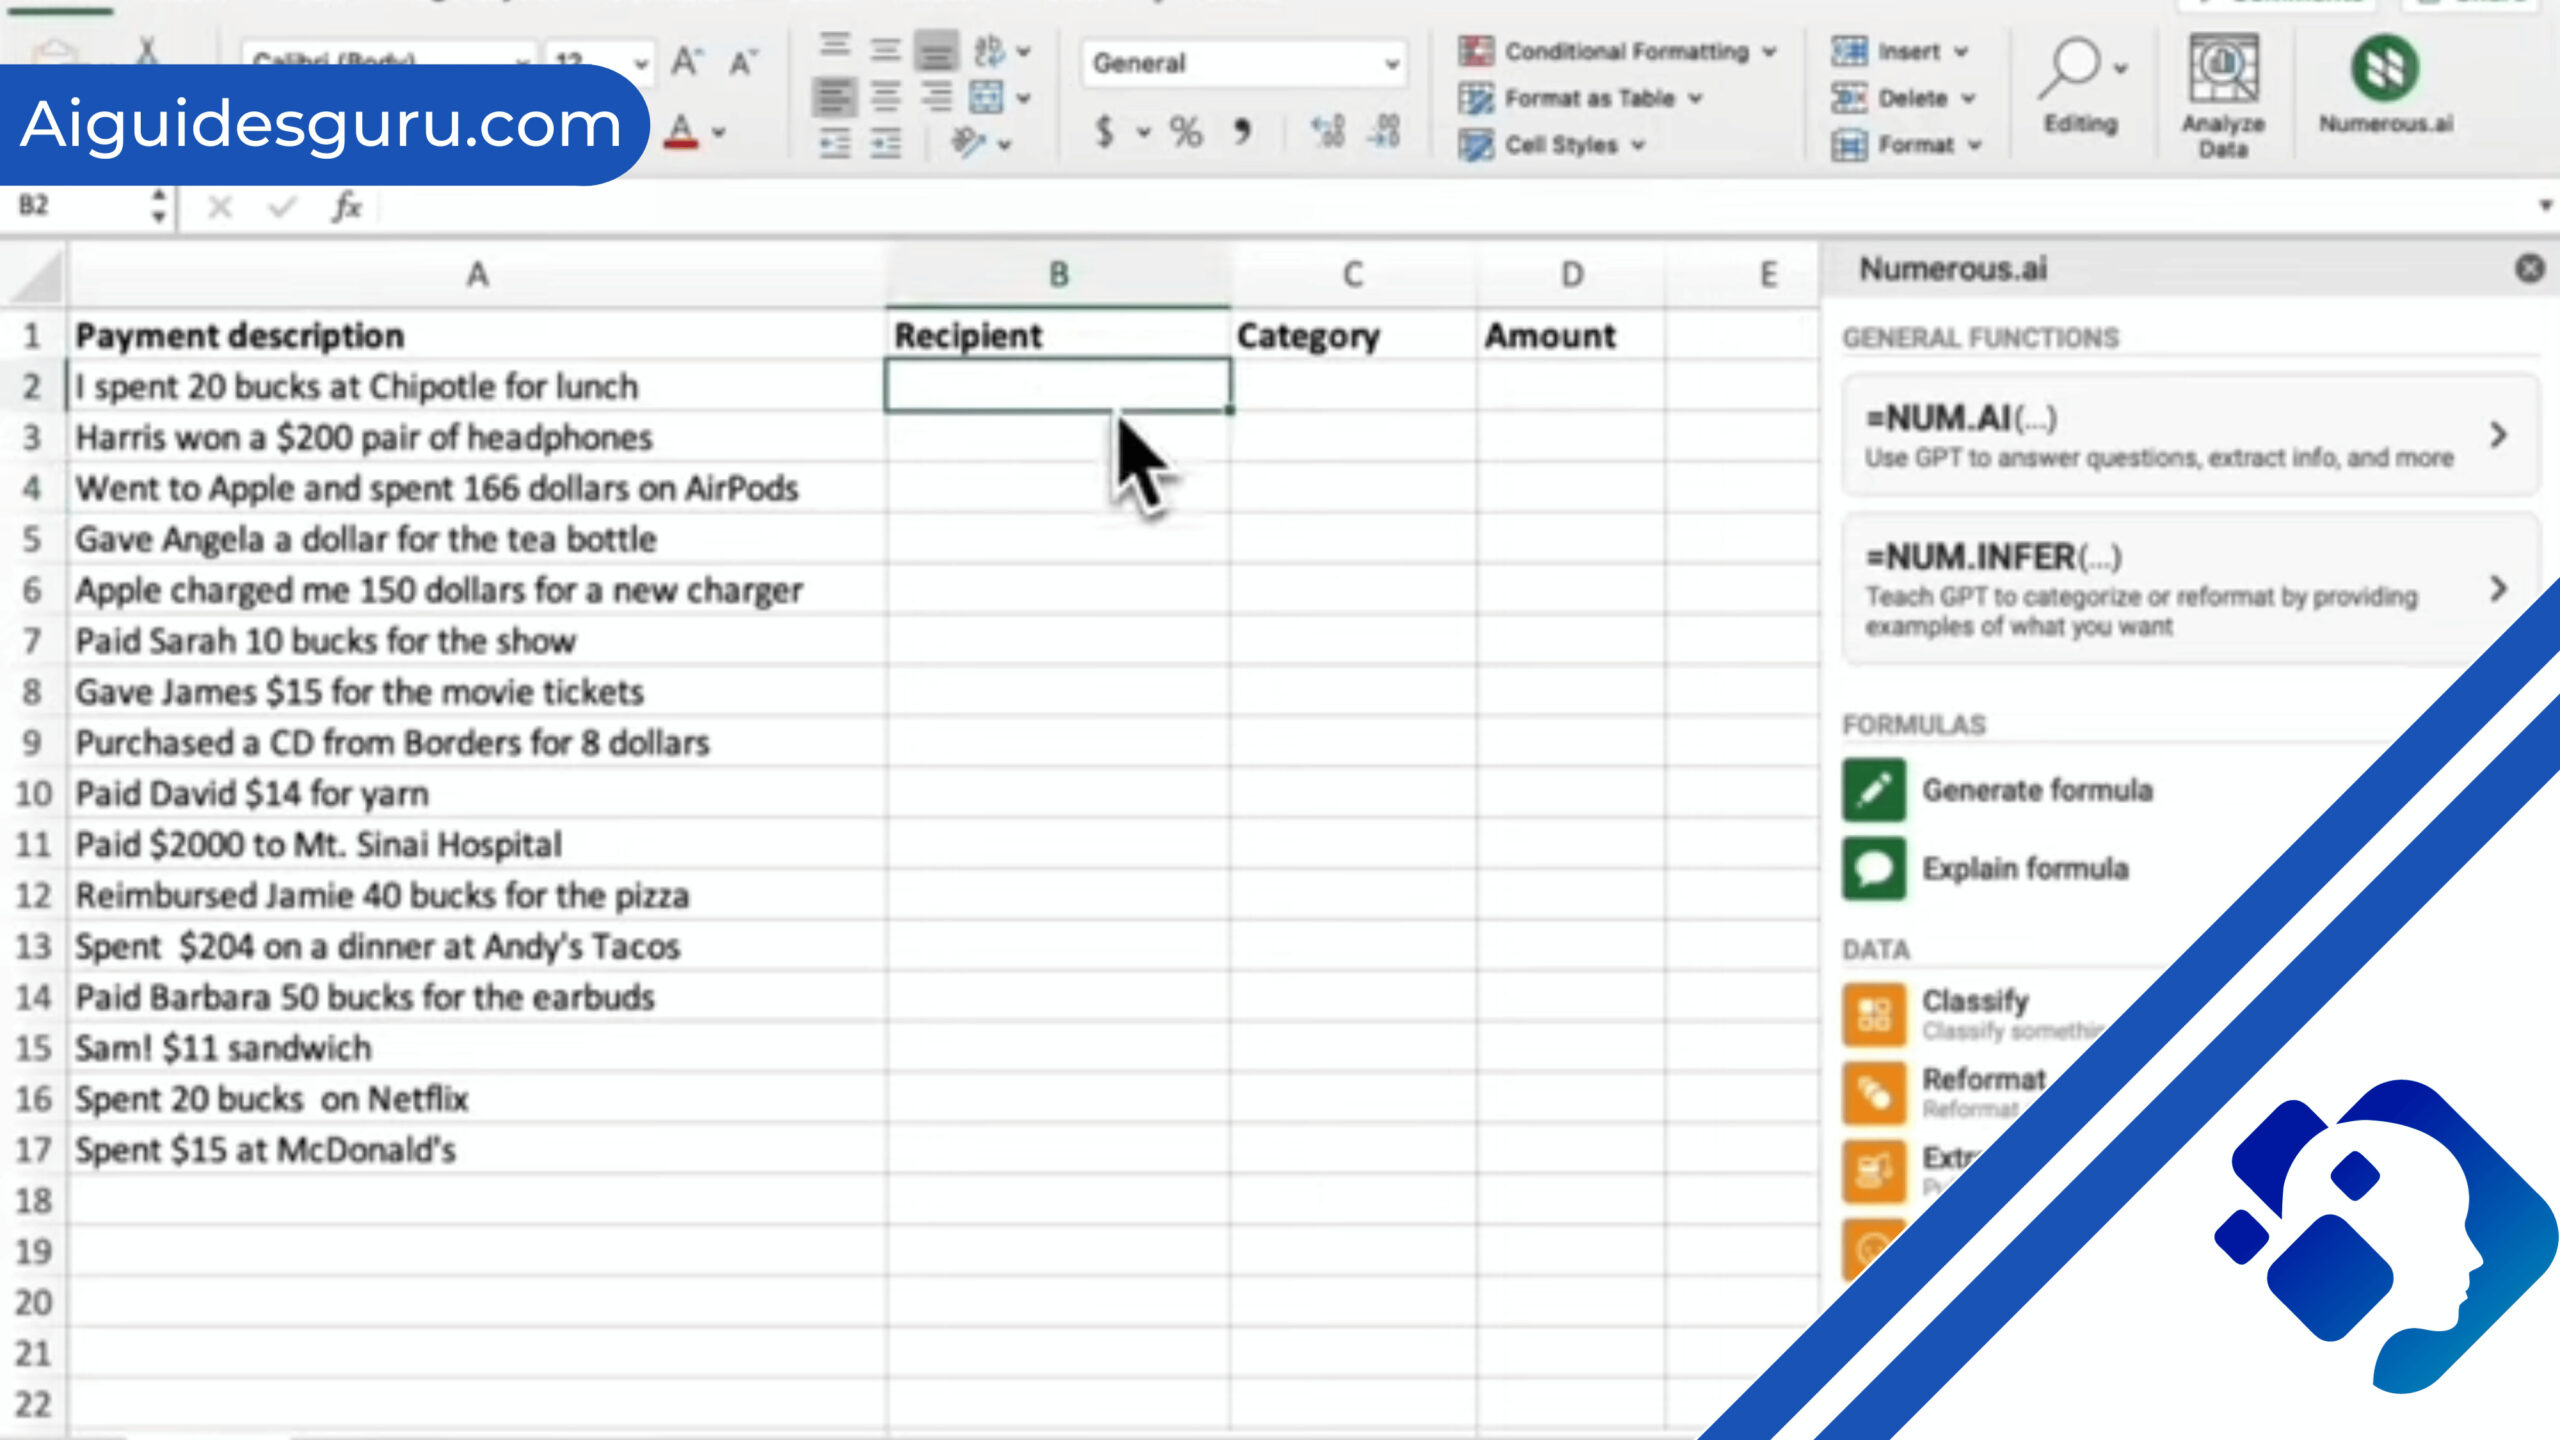
Let’s say you have a large dataset in Excel containing information about customer orders, including the customer’s name, order date, product purchased, quantity, and price. You want to analyze this data to gain insights about customer behavior and identify trends.
Cleaning and Preparing the Data:
Start by cleaning and preparing the data in Excel. Remove any duplicates, handle missing values, and ensure the data is properly formatted. You can use Excel’s built-in functions and tools to perform these tasks efficiently.
Formulating Questions:
Define the questions you want to answer based on the data. For example, you may want to know:
What are the top-selling products?
Which customers made the highest number of purchases?
Is there a correlation between order quantity and price?
Interacting with ChatGPT:
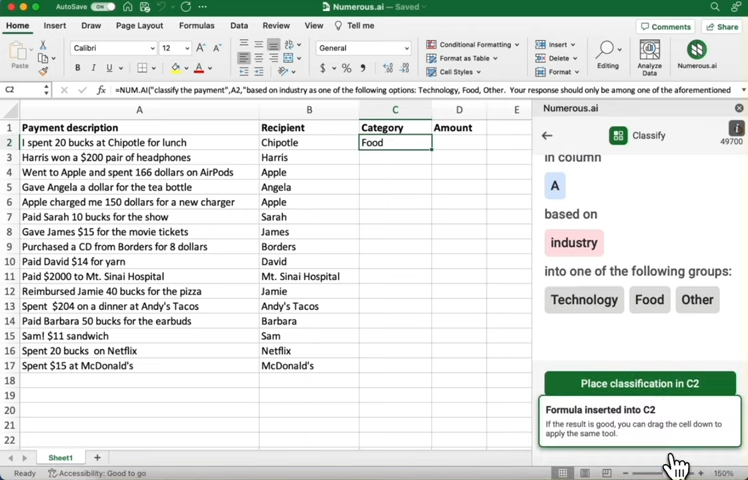
Now, you can interact with ChatGPT within Excel using its natural language capabilities. Type your question or query in a cell and use the “=” sign followed by the ChatGPT function to get a response.
For example, in cell B2, you can enter the formula =ChatGPT(“What are the top-selling products?”). ChatGPT will process your question and provide a response in the cell.
Visualizing the Results:
To visualize the results, you can use Excel’s charting capabilities. For instance, you can create a bar chart to display the top-selling products or a scatter plot to explore the relationship between order quantity and price.
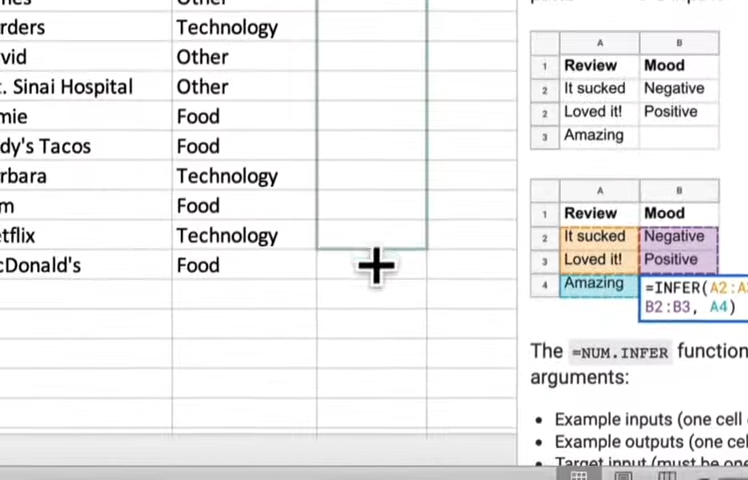
Iterative Analysis:
You can iterate this process by asking additional questions or refining your queries based on the obtained insights. For example, you may ask ChatGPT to identify customers who made high-value purchases in a specific time period or analyze sales trends over monthly or quarterly intervals.
Remember to validate the results obtained from ChatGPT by cross-referencing them with established data analysis techniques and common sense. While ChatGPT can provide valuable insights, it’s important to critically evaluate its responses and consider them in the context of your data.
By leveraging the natural language capabilities of ChatGPT in Excel, you can streamline your data analysis process, quickly ask questions, and obtain meaningful insights from your dataset.
Conclusion
Using ChatGPT to analyze Excel data can be a valuable addition to your data analysis workflow. Here are some key conclusions about how to effectively utilize ChatGPT for Excel data analysis:
Integration: Integrate ChatGPT within Excel by leveraging its natural language processing capabilities. Use the “=” sign followed by the ChatGPT function in Excel cells to ask questions or query the data.
Data Preparation: Prioritize data cleaning and preparation to ensure accurate and reliable results. Remove duplicates, handle missing values, and format the data appropriately before using ChatGPT.
Define Objectives: Clearly define your analysis objectives and formulate questions to guide your analysis process. This helps you stay focused and ensures that you extract relevant insights from the data.
Visualization: Utilize Excel’s charting capabilities to visualize the results obtained from ChatGPT. Visualizations provide quick and intuitive representations of data patterns, trends, and relationships.
Iterative Analysis: Engage in iterative analysis by asking additional questions or refining queries based on the insights obtained. This process allows for deeper exploration and a more comprehensive understanding of the data.
Validation: Validate the results obtained from ChatGPT by cross-referencing them with established data analysis techniques, statistical tests, or subject matter experts. This ensures the accuracy and reliability of the insights derived.
Critical Evaluation: Maintain a critical mindset when interpreting the responses from ChatGPT. Consider the context of the data, evaluate the plausibility of the answers, and exercise caution when making decisions based on the generated insights.
Collaboration: Engage with the ChatGPT and Excel data analysis community through online forums, social media groups, or specialized communities. Collaborating with others can provide valuable insights, support, and feedback.
By following these key conclusions, you can effectively utilize ChatGPT to analyze Excel data and gain meaningful insights for decision-making and problem-solving. Remember to combine the power of ChatGPT with established data analysis techniques to ensure accurate and reliable results.
FAQs
Q1: How do I integrate ChatGPT with Excel for data analysis?
A1: To integrate ChatGPT with Excel, use the “=” sign followed by the ChatGPT function in Excel cells. Input your question or query within the function to obtain responses from ChatGPT based on your Excel data.
Q2: Can ChatGPT handle complex data analysis tasks in Excel?
A2: ChatGPT can assist with various data analysis tasks in Excel, including answering questions, providing insights, and guiding the analysis process. However, for more complex analyses, it’s recommended to combine ChatGPT with established data analysis techniques and tools within Excel.
Q3: How can I validate the results obtained from ChatGPT in Excel?
A3: Validating the results is crucial. Cross-reference the responses from ChatGPT with established data analysis techniques, statistical tests, or subject matter experts. It’s important to critically evaluate the plausibility and accuracy of the insights provided by ChatGPT.
Q4: Are there any limitations to using ChatGPT for Excel data analysis?
A4: While ChatGPT is a powerful tool, it has limitations. It relies on the quality and cleanliness of the data in Excel. Additionally, it may not always understand complex queries or provide accurate responses. It’s essential to exercise caution, critically evaluate the results, and use ChatGPT as a complementary tool alongside other data analysis techniques.